
Historical Tick – Level 1 Australian 200 Futures Data AP (AP)
Australian 200 Contract Specs:
| Australian 200 (AP) | |
| AKA: | Australian 200 |
| Exchange Name: | Sydney Futures Exchange |
| Exchange: | SFE |
| Sector: | Index |
| Tick Size: | 1 |
| BPV: | 25 |
| Denomination: | AUD |
| Bloomberg Symbol: | XP Index |
| CSI Symbol: | YAP2 |
Buy Australian 200 Futures Data AP (AP)
Purchase Australian 200 Futures Data AP (AP) from PortaraCQG. Our tailored service includes your format options. ALL data is created for you by a qualified trader. We provide expert guidance if you are unsure. we will email you when your purchase has completed with roll/format options to choose from.
AP (AP) Historic Futures Data: Available
| Data Type | Start Date | End Date | Size | Sample Data |
| Daily: | 2000 May 02 | Current | 1.7 MB | 📈 Download |
| Intraday: | 2000 May 01 | Current | 223.9 MB | 📈 Download |
| Tick – Trades Only: | 2000 Sep 12 | Current | 3.9 GB | 📈 Download |
| Tick – Level 1: | 2000 Sep 08 | Current | 98.3 GB | 📈 Download |
Full-history size of Australian 200 (AP) data from Portara, to the current date, as uncompressed CSV text: daily 1.7 MB from 2000 May 02; 1-minute intraday 223.9 MB from 2000 May 01; tick trades-only 3.9 GB from 2000 Sep 12; tick Level 1 (bids, asks and trades) 98.3 GB from 2000 Sep 08. Sizes are indicative and refreshed monthly. Use the Data Size Calculator further down this page for any year range.
See also: all historical tick Level 1 markets · view the AP sample in any timezone · when AP volume and open interest begin.
Or Subscribe To Portara Downloader
Get access to our ‘historical futures and forex data cloud’. Simply ‘drag & drop’ daily, intraday, tick and level 1 quote data straight to your desktop, whenever you need it! You can format the data on the fly.
Watch this video for further information >>
Please note: The free-tier offer is currently unavailable.
Times default to Chicago local, as recorded. Pick a timezone to convert both the chart and the download — conversion changes only the timestamps, every other value passes through untouched.
Sample data chart · hover for values · drag to pan · zoom with the mouse wheel or the −/+ buttons · double-click to reset
Australian 200 AP Tick Level 1 Data Formats
Choose a data form to see the format choices available for it.
Once payment is in, we will send across final formatting options for you to choose from and then add you to our jobs list for processing. See below for what questions we will ask.
One-off data dump:
- Delivery Months: HMUZ (Mar, Jun, Sep, Dec)
- Delimiter: comma, i.e. .csv .txt - ASCII. Or choose another delimiter such as semi-colon, space or tab
- Filename: Discrete names created from the symbol root, the year and delivery month code, one contract per file. For example AP2026H is the March 2026 contract for Australian 200. Where a contract is large it is split into a series of discrete, sequential files with a numbered suffix, AP2026H_001.txt, AP2026H_002.txt... etc based on the size of your data. Openable in notepad or similar. Windows/Mac/Linux compatible.
- Filename Alternatives: Choose from the following if you require compatibility elsewhere: Bloomberg: XP Index · CSI: YAP2
- Column Order: timestamp, price, volume, dataType, correction, marketState
- Flags: the three flag columns on every row
- dataType: B = best bid update, A = best ask update, T = trade. Every row is one of these three events.
- correction: R = regular. D = deleted, I = inserted and U = updated are exchange corrections to earlier events. We include them by default and can exclude any of the three.
- marketState: N = normal. F = fast market, an old flag only seen in pit-era data up to November 2006. Every row since is N.
- Timezone: Exchange Time, Australian Eastern Time (Sydney, AEST / AEDT). Or choose a custom timezone such as UTC
- Timestamp format: yyyymmdd hh:mm:ss.fffiTimestamp keyyyyy = yearmm = monthdd = dayhh = hour (24h)mm = minutess = secondfff = milliseconds (precision 1/1000 of a second)
- Pre-2014 timestamps: Prior to mid-2013, there was no such thing as milliseconds or seconds in the timestamp. Obviously, all the trades are in the correct order. The timestamp in the file will be identical but will exhibit zeros for seconds and milliseconds prior to mid-2013.
- No Aggregation: All pure tick data is per-event with no aggregation.
- Alternative Formats: Other common formats can be extracted such as the case for NinjaTrader, yyyyMMdd HHmmss fffffff;price;bestBid;bestAsk;volume (one line per trade carrying the prevailing best bid and ask). In this case trade, bid and ask volumes are aggregated per row and semicolon separated. Speak to us on a per case basis.
- Other Special Data Formatting Requirements: We format directly for other software applications including Bloomberg, CQG Data Factory, eSignal, IQFeed, MetaTrader 5, MultiCharts, NinjaTrader, Sierra Chart, TradeStation and Trading Blox.
During your order process, we will send across these final formatting options for you to choose from and then add you to our jobs list for processing.
One-off data dump:
- Continuous data: Do you want backadjusted or zero adjusted data? Please let us know. If you are unsure, please read our deep dive on how to create continuous futures data, which explains the different methods.
- Roll: 3 days before expiry is a good sweetspot for AP
- Roll Basis: Roll based on settlement price. (Highly unusual based on last price, but we can do it)
- Delivery Months: HMUZ (Mar, Jun, Sep, Dec)
- Delimiter: comma, i.e. .csv .txt - ASCII. Or choose another delimiter such as semi-colon, space or tab
- Filename: A series of discrete, sequential files called AP.txt or AP_001.txt, AP_002.txt... etc based on the size of your data openable in notepad or similar. Windows/Mac/Linux compatible.
- Filename Alternatives: Choose from the following if you require compatibility elsewhere: Bloomberg: XP Index · CSI: YAP2
- Column Order: timestamp, price, volume, dataType, correction, marketState
- Flags: the three flag columns on every row
- dataType: B = best bid update, A = best ask update, T = trade. Every row is one of these three events.
- correction: R = regular. D = deleted, I = inserted and U = updated are exchange corrections to earlier events. We include them by default and can exclude any of the three.
- marketState: N = normal. F = fast market, an old flag only seen in pit-era data up to November 2006. Every row since is N.
- Timezone: Exchange Time, Australian Eastern Time (Sydney, AEST / AEDT). Or choose a custom timezone such as UTC
- Timestamp format: yyyymmdd hh:mm:ss.fffiTimestamp keyyyyy = yearmm = monthdd = dayhh = hour (24h)mm = minutess = secondfff = milliseconds (precision 1/1000 of a second)
- Pre-2014 timestamps: Prior to mid-2013, there was no such thing as milliseconds or seconds in the timestamp. Obviously, all the trades are in the correct order. The timestamp in the file will be identical but will exhibit zeros for seconds and milliseconds prior to mid-2013.
- No Aggregation: All pure tick data is per-event with no aggregation.
- Alternative Formats: Other common formats can be extracted such as the case for NinjaTrader, yyyyMMdd HHmmss fffffff;price;bestBid;bestAsk;volume (one line per trade carrying the prevailing best bid and ask). In this case trade, bid and ask volumes are aggregated per row and semicolon separated. Speak to us on a per case basis.
- Roll Logs: we will include a full roll log showing rolls close-to-close the calendar days and the adjustments so you can follow through the logic.
- Other Special Data Formatting Requirements: We format directly for other software applications including Bloomberg, CQG Data Factory, eSignal, IQFeed, MetaTrader 5, MultiCharts, NinjaTrader, Sierra Chart, TradeStation and Trading Blox.
During your order process, we will send across these final formatting options for you to choose from and then add you to our jobs list for processing.
The Process of Placing an Order
Portara is a ‘tailored service’ i.e. your request will be processed manually to your custom requirements.
If you wish to proceed, send us an email using the ‘Contact Portara’ widget on this page, or alternatively use the Contact Form under ‘Contact Us’. When you are happy, we will send out a payment request for settlement. Once payment is in, we will send across final formatting options (above) for you to choose from and then add you to our jobs list for processing.
We will guide you through the final formatting options and provide defaults for you to accept or make changes to.
Once the data is ready, we will send across your personal link for you to download the data. Usually, data is ready within 24hrs.
 Portara discusses the Australian 200 AP (AP)
 Portara discusses the Australian 200 AP (AP)
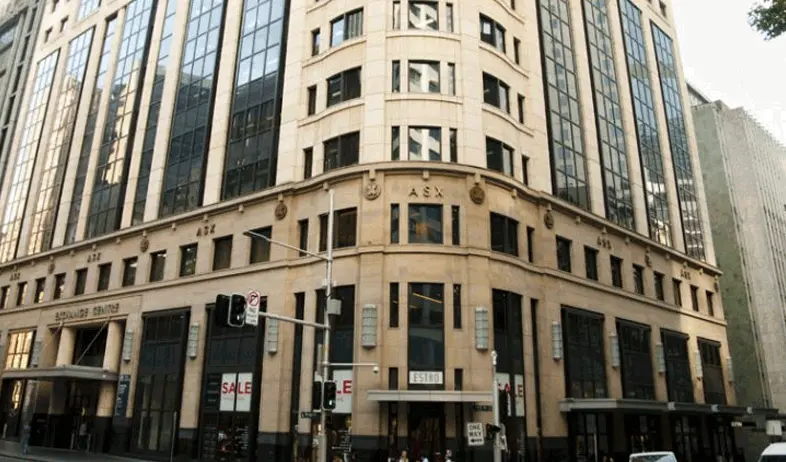
The Australian 200 Index (A.K.A. ASX 200, symbol AP) is a popular stock market index that provides investors with a snapshot of the performance of the top 200 companies listed on the Australian Securities Exchange (ASX). This index is widely used by traders and investors to track the overall health of the Australian economy and make informed investment decisions. In this article, we’ll take a closer look at how the Index works and what factors can impact its performance.
What is the Australian 200 Index?
The ASX 200 Index is a stock market index that tracks the performance of the top 200 companies listed on the Australian Securities Exchange (ASX). This index is weighted by market capitalization, which means that larger companies have a greater impact on the index’s performance. The ASX 200 Index is widely used by traders and investors to track the overall health of the Australian economy and make informed investment decisions. It is also used as a benchmark for many investment funds and exchange-traded funds (ETFs) that track the Australian stock market.
How is the Index calculated?
The Australian 200 Index is calculated using a market capitalization-weighted methodology. This means that the companies with the largest market capitalization have a greater impact on the index’s performance. The market capitalization of each company is calculated by multiplying the number of outstanding shares by the current market price of each share. The total market capitalization of the top 200 companies is then divided by a divisor to arrive at the index value. The divisor is adjusted periodically to account for changes in the market.
What companies are included in the Australian 200 Index?
The Australian 200 Index includes the top 200 companies listed on the Australian Securities Exchange (ASX) based on market capitalization. This includes companies from a variety of industries such as financials, healthcare, materials, energy, and consumer staples. Some of the largest companies included in the index are Commonwealth Bank of Australia, BHP Group, CSL Limited, Westpac Banking Corporation, and Rio Tinto Group. The composition of the index is reviewed quarterly to ensure that it remains representative of the top 200 companies on the ASX exchange.
What are the benefits of investing in the ASX 200?
Investing in the Australian 200 Index can provide a number of benefits for investors. Firstly, it offers exposure to a diverse range of industries and companies, which can help to spread risk and reduce volatility. Additionally, the index has historically delivered strong returns over the long term, making it an attractive option for investors seeking capital growth. Finally, the index is highly liquid, meaning that it is easy to buy and sell shares, which can be important for investors who need to access their funds quickly.
How can investors trade the ASX 200 Index?
Investors can trade the Australian 200 Index through a variety of financial instruments, including exchange-traded funds (ETFs), index funds, and contracts for difference (CFDs). ETFs and index funds are passive investment vehicles that track the performance of the index, while CFDs allow investors to speculate on the price movements of the index without actually owning the underlying assets. Investors can also trade the index directly through the ASX 200, either by buying individual stocks or by investing in a managed fund that focuses on the top 200 companies. It is important for investors to do their research and choose the investment vehicle that best suits their individual needs and risk tolerance.
Why Nasdaq 100 Futures Are Key to Capitalizing on Tech Industry Trends
Crude Oil Futures & The Future Of Renewable Energy
Format Details for Australian 200 AP (AP)
Alternative Australian 200 Symbology:
Other companies can refer to the Australian 200 symbols by the following symbol names: YAP2 AP XPA Index.
Portara and CQG provide historical intraday futures data to CTAs, hedge funds, portfolio managers, quants and traders and institutions.
Portara’s Main Data Products
Australian 200 futures data can be split into four main headings:
- Daily data – which includes either the last price or the settlement
- Intraday data – which includes trade volume
- Tick data – Trades Only – which includes only trades
- Tick data Level 1 – which includes the trades, the bid, the ask and the settle
Purchase Individual or Continuous form Data
You can purchase historical intraday AP / AP futures data as individual contracts or in a continuous form.
Continuous 1 minute AP / AP futures data can be formatted into back-adjusted, forward-adjusted, ratio adjusted and zero adjusted series. Portara can create bespoke rules for each futures AP contract based on volume, open interest, tick size and calendar date variations. Control delivery month combinations, timezone settings and timestamps that follow exchange or local time globally for any location.
World’s Only Data Supplier with FIVE DAILY Data Points
Portara’s standard Australian 200 daily futures data is made up of five data points – open, high, low, last-price and settle. Simply choose to have the daily close based on the last price or the settle depending on whether you wish follow extended sessions or just the day session.
AP Data Granularity
Portara’s Australian 200 intraday futures data is supplied as default in 1-minute bar. However, you may also choose other bar granularities such as 2 minute bar, 3 minute bar, 5 minute bar, 10 minute bar, 15 minute bar, 30 minute bar, hourly bar etc. You can also have us extract daily Australian 200 data straight from the intraday database. In this case, you would choose the session (even if you need to cross midnight) and we can supply the custom Australian 200 daily futures data between only between the custom session markers you choose.
Portara provides AP futures tick data in ‘Trades Only’ form or as ‘Level 1’ tick data, which includes the bids and asks. Download the tick data samples above. Our default format timestamp is to the millisecond. Australian 200 tick data includes price, the trade volume, and other trade indicators such as bid, ask, trade and settle.
Remember to compare the file size of trades only data to level 1 tick data as they can vary by factors of 10 to 100 fold. If you have questions simply email us and one of our technicians will guide you.
Updates
All of our historical data is updated on a daily basis up to four times per day based on your subscription level, at the end of the Asian, European, Early US and Globex session. Portara’s enterprise software solution provides timely updates to your data, along with compression, roll and custom formatting features on CQG deep history databases. Historical Australian 200 data updates are ready around half an hour after markets close. No exchange fees or other CQG products are necessary.
Portara’s Catalogue of Historical Australian 200 Futures Data AP
You can view other futures, forex, ETFs and fixed income symbols and commodities from the Historical Intraday Data Download Table. If you are looking for derivatives of the Australian 200 or any other historical data types such as daily or tick, you can visit the other download tables here:
- Historical Daily Data Download Table
- Historical Intraday Data Download Table
- Historical Tick – Trades Only Data Download Table
- Historical Tick – Level 1 Data Download Table
To discuss AP / AP Futures data or if you have any other enquiry please reach out to us using the widget in the bottom corner or our contact page if you have visited us via mobile phone.